Executive & Strategy
FactoryKPI Executive
KPI Dashboard with Multi-plant analytics and comparisons
Problem Solving
SolvoNext-PDCA
A Smarter Problem Solving and Project Management Software based on deming and Toyota's PDCA - Plan, Do, Check, Act Method.
Qualitygram
A Unique Mobile and Web Software that helps Manage and Solve Problems Faster with Improved Team Communication.
SolvoNext-NCR CAPA
Digitize your NCR & CAPA process and Reduce Cost of Poor Quality (COPQ).
How a Quality Manager Can Leverage KPIs & Metrics for Continuous Improvement in Manufacturing?
September 24, 2024
In today’s fast-paced manufacturing world, standing still means falling behind. For any factory aiming to stay competitive, continuous improvement isn’t just a goal—it’s a necessity. But how can a Quality Manager drive this ongoing evolution effectively? The answer lies in one critical tool: Key Performance Indicators (KPIs). KPIs provide the roadmap for identifying inefficiencies, spotting trends, and making data-driven decisions that propel operational excellence.
By leveraging the right metrics, Quality Managers can lead their teams to not only meet but exceed quality standards, ensuring sustainable growth and success in an ever-changing industry. Ready to unlock the full potential of continuous improvement?
Let’s dive into how KPIs make it happen.
How does KPIs help in Driving Continuous Improvement for Manufacturing Quality?
Continuous improvement (CI) is more than just a trend in manufacturing; it's essential for staying competitive in an ever-evolving industry. For modern manufacturers, CI is about refining processes, reducing waste, and improving product quality consistently. The key to driving these improvements is data—specifically, Key Performance Indicators (KPIs) that offer measurable insights into performance.
KPIs are crucial because they provide an objective way to track performance, identify gaps, and monitor progress. Without measurable metrics, it’s impossible to determine whether changes are positively impacting processes. KPIs act as the "health check" for manufacturing, enabling Quality Managers to see where improvements are needed and whether corrective actions are effective.

For a Quality Manager, KPIs are more than just numbers—they are the foundation of data-driven decision-making. The role of a Quality Manager in CI has evolved from merely ensuring compliance or conducting audits to leading the charge for process optimization. KPIs allow managers to identify bottlenecks, inefficiencies, and areas for improvement, helping to achieve operational efficiency, cost savings, and superior product quality.
Measuring continuous improvement metrics also helps forecast future challenges. For example, a downward trend in OEE or FPY can signal equipment wear or the need for process adjustments. By closely tracking KPIs, Quality Managers can take proactive steps to prevent issues before they escalate.
In short, continuous improvement without metrics is like driving blindfolded. KPIs provide the vision and clarity needed to navigate the complexities of manufacturing quality, ensuring that every improvement is data-backed and strategically aligned with the company’s goals. This is why every forward-thinking manufacturing organization places continuous improvement, driven by KPIs, at the forefront of its operational strategy.
Key Metrics for Quality Managers in Driving Continuous Improvement
To drive meaningful improvements, a Quality Manager must focus on the right KPIs. Below are some of the most critical metrics that guide continuous improvement initiatives:
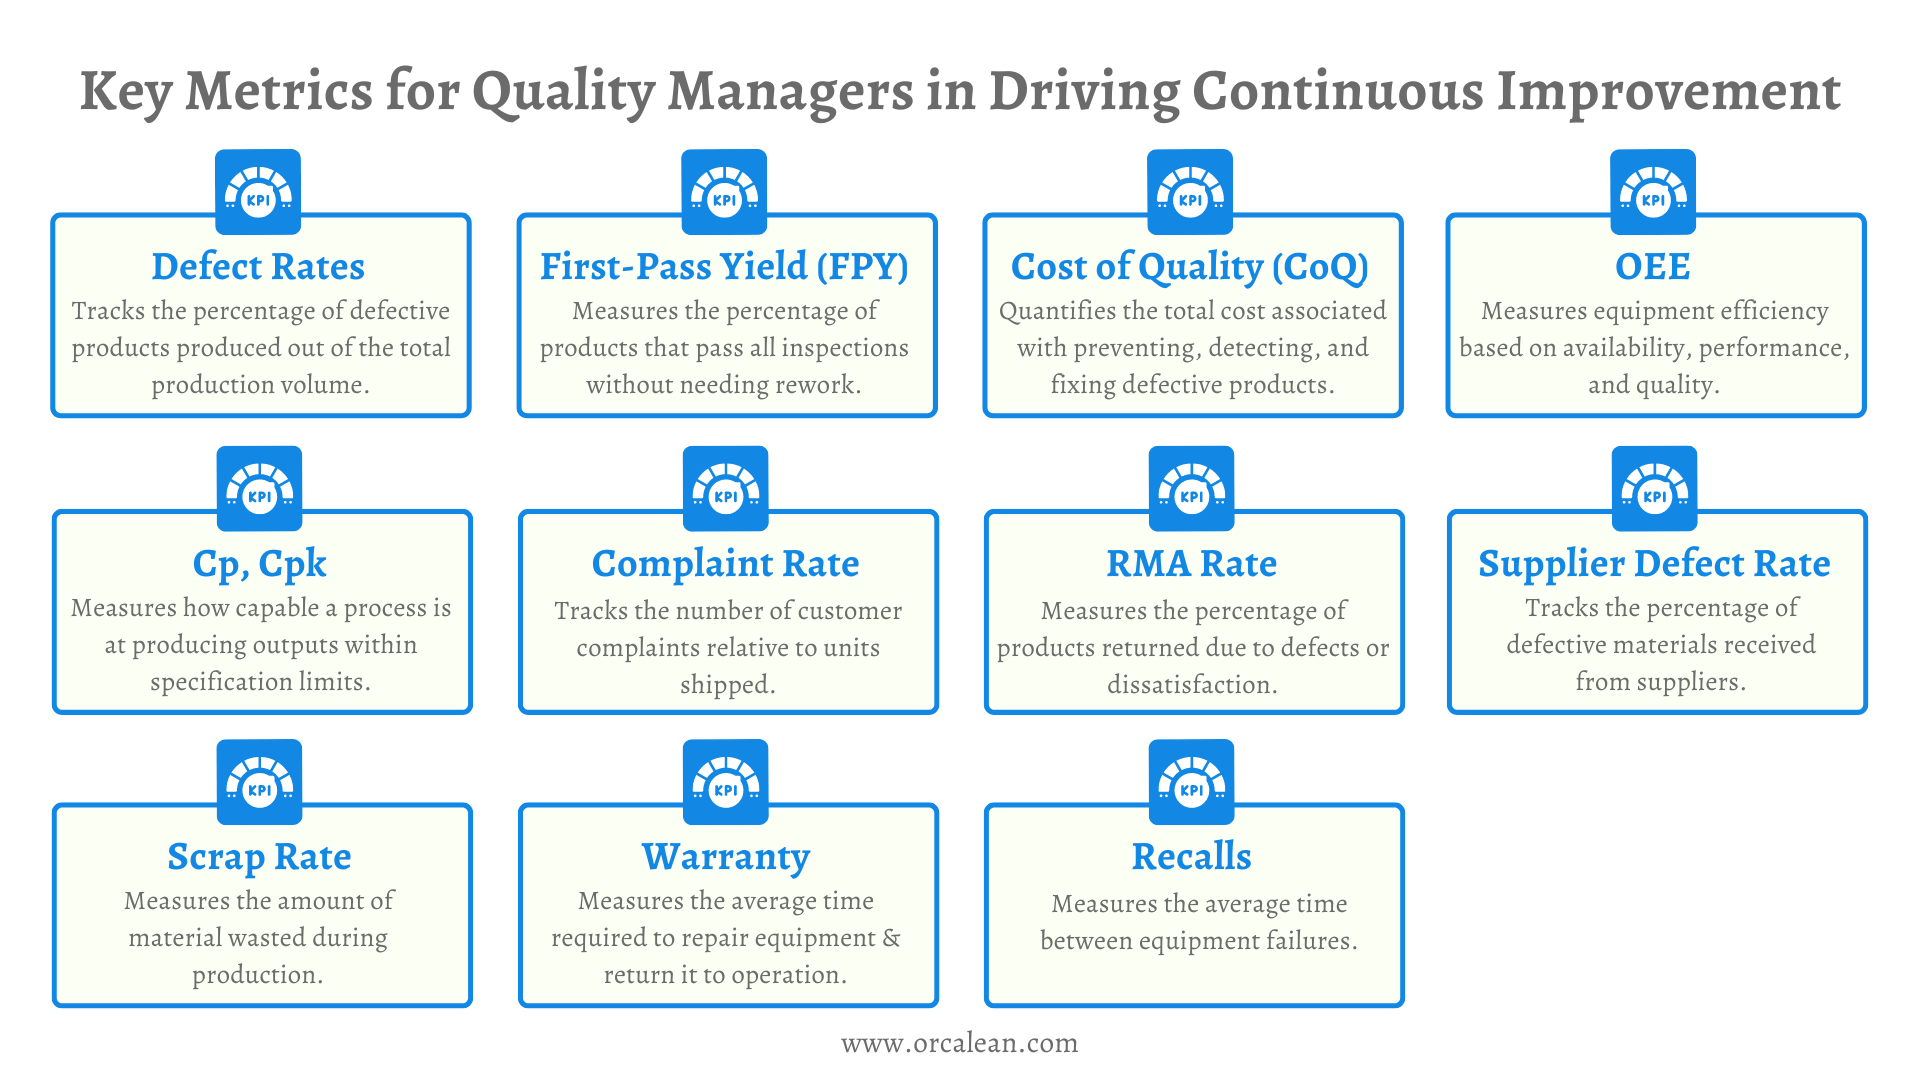
- Defect Rates: One of the most fundamental quality metrics, defect rates measure the number of defective items produced as a percentage of total output. High defect rates lead to rework, scrap, and customer dissatisfaction. Quality Managers can monitor and improve defect rates using tools like this Quality Calculator, which helps quantify and manage key quality metrics.
Example: A plant consistently found 5% defects in a specific product line. By analyzing the data and using root cause analysis, they discovered that a machine calibration issue caused the problem. After adjustments, defect rates dropped to 1%, reducing scrap and improving customer satisfaction. |
- First-Pass Yield (FPY): FPY measures the percentage of products that pass all inspections without needing rework. This metric is critical for assessing process efficiency and identifying areas where errors are introduced.
Example: In a high-volume production line, FPY was found to be 85%. After analyzing the data, it was discovered that a significant amount of rework was needed on one component. By refining the assembly process, FPY was raised to 95%. |
- Cost of Quality (CoQ): CoQ tracks the total cost associated with ensuring product quality, including both prevention and correction costs. This metric helps in understanding how much poor quality costs the company.

To evaluate your own CoQ, try this Cost of Quality Calculator for a clearer picture of how quality issues impact your bottom line.
Example: A manufacturer noticed that its external failure costs (returns and warranties) were steadily increasing. By addressing internal process inefficiencies and improving training, they reduced external failure costs by 30%. |
- Overall Equipment Effectiveness (OEE): OEE is a composite metric that measures equipment efficiency based on availability, performance, and quality. It provides insights into machine productivity and helps identify inefficiencies in production lines.
You can easily calculate OEE using this OEE Calculator to better understand your equipment’s performance and take proactive steps toward continuous improvement.
Example: By tracking OEE, a plant discovered that unplanned downtime was contributing to a drop in production. Through regular maintenance and better planning, they increased OEE from 65% to 80%. |
- Process Capability Indices (Cp, Cpk): These metrics measure how capable a process is of producing output within specification limits. Higher Cp and Cpk values indicate a more capable process with less variation.
Example: A Quality Manager noticed that the Cpk for a critical process was below 1.33, indicating high variability. After implementing tighter process controls, they improved Cpk to 1.5, reducing defects. |
- Customer Complaint Rate: This metric tracks the number of customer complaints relative to units shipped. It’s a direct reflection of the product’s quality in the customer’s hands and is essential for maintaining customer satisfaction and loyalty.

Example: A manufacturing company reduced its customer complaint rate by 15% after implementing more stringent quality checks at the final inspection stage. |
- Return Material Authorization (RMA) Rate: RMA rate measures the percentage of products that customers return due to defects or dissatisfaction. A high RMA rate indicates significant quality issues and can lead to costly warranty claims.
Example: After a spike in RMAs for a specific product, the Quality Manager conducted a root cause analysis and discovered that a faulty supplier component was the cause. They worked with the supplier to improve quality, reducing RMAs by 25%. |
- Scrap Rate: Scrap rate measures the amount of material wasted during production. High scrap rates indicate inefficiency and cost overruns. Reducing scrap rates is a direct path to improving both quality and profitability.

Example: A manufacturer reduced its scrap rate by optimizing its cutting process and introducing more precise machine calibrations, saving thousands of dollars in raw materials each month. |
- Warranty Claims: Tracks the number and cost of warranty claims due to product defects or failures. A high number of warranty claims can significantly impact the company’s profitability and indicates recurring quality issues that need resolution.
Example: A car manufacturer experienced a spike in warranty claims for a specific engine component, resulting in costly repairs and replacements. By analyzing the root cause, they found a flaw in the supplier’s materials. After switching suppliers and improving quality control, warranty claims for the component dropped by 30%, saving the company millions in repair costs. |
- Product Recalls: Measures the frequency and severity of product recalls due to serious defects or safety issues. Recalls can damage a company’s reputation and lead to substantial financial losses, making this a critical metric to track.
Example: An appliance manufacturer recalled washing machines due to a fire hazard from faulty wiring. They addressed the issue by redesigning the wiring system and improving inspection, preventing further recalls and protecting their brand’s reputation. |
- Cycle Time: Cycle time measures the total time taken to complete one cycle of a process, from start to finish. Reducing cycle time is a key element of lean manufacturing and process improvement.
To better understand the difference between cycle time and takt time and how each impacts your production processes, check out this detailed article on Takt Time vs. Cycle Time.
Example: By analyzing and reducing unnecessary steps in the production process, a Quality Manager was able to reduce cycle time by 10%, increasing overall productivity. |
How to Measure Continuous Improvement Metrics: Practical Methods for Quality Managers?
Measuring continuous improvement metrics effectively requires a logical and structured approach. Quality Managers must ensure that the data collected is both relevant and actionable to drive meaningful improvements.
Here are the key steps for measuring continuous improvement metrics:

1. Define Clear Objectives
Begin by identifying the specific improvement goals. Whether you aim to reduce defects, enhance equipment efficiency, or improve customer satisfaction, the goals must be clearly defined. This will help in selecting the most relevant metrics to track.
2. Select the Right KPIs
Once the objectives are clear, choose the appropriate KPIs that align with these goals. For example, if your goal is to improve production efficiency, KPIs like Overall Equipment Effectiveness (OEE) or First-Pass Yield (FPY) should be prioritized. Selecting relevant KPIs ensures that the metrics provide useful insights.
3. Establish a Baseline
Before implementing any changes, establish a baseline for each KPI. This provides a reference point to measure progress and improvements. Collect historical data from past production cycles or current operational conditions to create accurate baselines.
4. Automate Data Collection
Manual data collection can introduce errors and delays. Leverage automation tools like Manufacturing Execution Systems (MES), Enterprise Resource Planning (ERP) software, or Quality Management Systems (QMS) to gather data continuously. Automated systems allow for real-time tracking and ensure accuracy.
5. Set the Frequency of Measurement
Determine how often each metric needs to be measured. Some KPIs, such as OEE or defect rates, may require real-time monitoring, while others, like Cost of Quality (CoQ) or customer complaints, may only need to be reviewed weekly or monthly. Tailoring the frequency ensures timely insights without overwhelming the team with excessive data.
6. Use Dashboards for Real-Time Monitoring
Visual dashboards allow for easy monitoring of KPIs in real-time. Dashboards should be customized to display the most critical metrics for quick decision-making. For example, a dashboard that tracks OEE can help identify performance issues and alert Quality Managers to potential bottlenecks or downtime.
7. Analyze the Data
After collecting the data, the next step is to interpret it. Use tools like Pareto Analysis or root cause analysis to determine the underlying factors influencing performance. This step helps in understanding whether processes need adjustments and provides insights into where improvements should be focused.
8. Implement a Feedback Loop
Establish a continuous feedback loop where KPIs are regularly reviewed, and corrective actions are taken based on the data. Set up regular meetings to discuss performance trends and engage teams in problem-solving efforts. This ensures that continuous improvement becomes a routine process.
9. Reassess KPIs Periodically
Continuous improvement is an ongoing effort, and as processes evolve, so should the KPIs being tracked. Periodically reassess whether the current KPIs are still aligned with the organization’s goals and adjust them as necessary. This keeps the improvement process dynamic and relevant.
By following these practical methods, Quality Managers can ensure that continuous improvement metrics are effectively measured and utilized to drive lasting improvements in manufacturing processes. Accurate measurement, timely insights, and a structured feedback loop are key to sustaining long-term success in continuous improvement.
The Bottom Line
For Quality Managers, the responsibility of driving continuous improvement goes far beyond ensuring compliance—it's about being the catalyst for change, optimization, and growth within a manufacturing organization. By leveraging KPIs such as defect rates, First-Pass Yield, Cost of Quality, and Overall Equipment Effectiveness, Quality Managers can gain critical insights into the health of their processes and equipment. These metrics aren’t just numbers; they are powerful tools that enable data-driven decision-making, pinpoint inefficiencies, and guide proactive improvements.
As the manufacturing landscape continues to evolve, Quality Managers are at the forefront of leading teams toward operational excellence. By measuring, monitoring, and acting on the right KPIs, they ensure that continuous improvement becomes a sustainable, ongoing process.
Whether it’s reducing waste, enhancing equipment performance, or improving product quality, the role of the Quality Manager is pivotal in shaping the future of manufacturing. With the right KPIs, tools, and strategies, they can unlock the full potential of their operations, driving superior results and long-term success.
Software Solutions for Manufacturing Excellence
Company
Social
Our Contact Info:
Email: contact@orcalean.com
Phone Number: 248 938 0375
Our Offices